
In the previous blog post in this series, we showed:
- Many proteoforms have multiple modifications.
- Not all theoretically possible tau proteoforms are detected.
- Differential proteoform profiles likely capture differential biology.
- The non-random creation of multiply modified proteoforms suggests there is order and timing underlying their generation.
In this post, we’ll further dive into the biological evidence suggesting that the specific, multiply modified proteoforms found in biological systems associate with important phenotypes. We further discuss how exploring associations between proteoforms and disease severity may accelerate research and enable the development of new precision medicines.
For more detail now:
- Read our full pre-print.
- Explore the quantitative benefits of Iterative Mapping of proteoforms in our Tech Note.
- Read our App Note discussing tau proteoform analysis.
- Watch our on-demand webinar covering this data.
Read all posts in this series covering:
- Metrics demonstrating the benefits of Iterative Mapping on the Nautilus Proteome Analysis Platform (Post 1).
- The new kinds of analysis Iterative Mapping of proteoforms enables (Post 2).
- How Iterative Mapping answers key questions about tau proteoform biology (Post 3).
- How our preliminary tau proteoform data demonstrates the potential impact of proteoform-level analysis on the development of next-generation therapeutics and biomarkers for not just ADRD, but all diseases (This post).
Distinct proteoform profiles may contrast distinct phenotypes
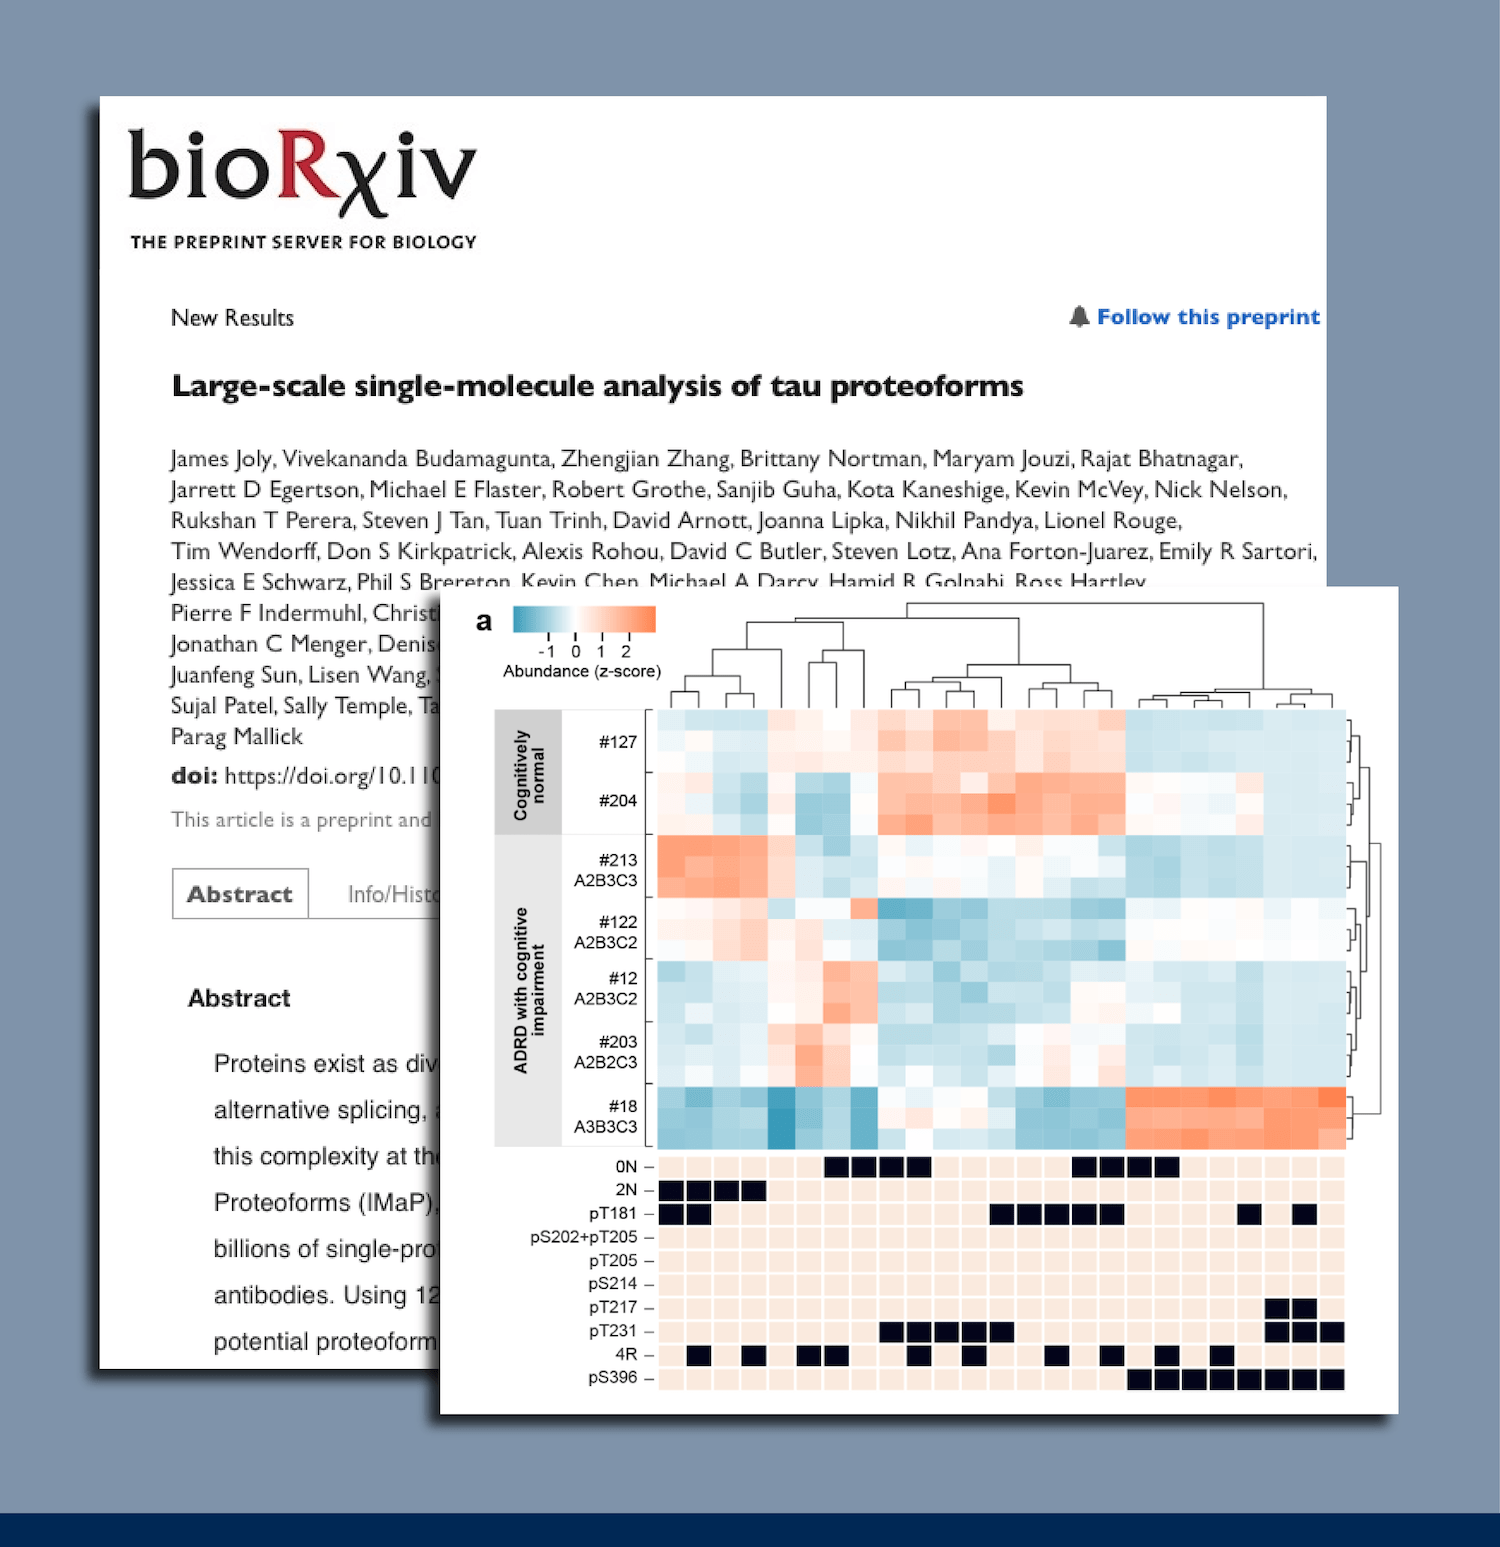
Tau proteoforms were measured in triplicate across the human brain samples described in Table 1. Proteoforms measured were hierarchically clustered and displayed in the heatmap shown in Figure 1. Replicate measurements cluster closely together demonstrating the high reproducibility of Iterative Mapping (3 replicates per sample). Further clustering reveals a close association between distinct proteoform profiles and different levels of Alzheimer’s Disease and Related Dementias (ADRD) severity as measured by brain pathology.
In the top level of the hierarchy, the ADRD replicates with cognitive impairment and the most severe pathology form a cluster that is separated from the other ADRD and cognitively normal replicates, but further down the hierarchy, the remaining ADRD samples form a new cluster that is separate from the cognitively normal samples. These preliminary yet intriguing results suggest that:
- Proteoform profiles differentiate cognitively impaired from cognitively normal samples.
- Proteoform profiles differentiate the one ADRD with cognitive impairment and most severe pathology from all other samples.
Box 1 – A brief introduction to Iterative Mapping
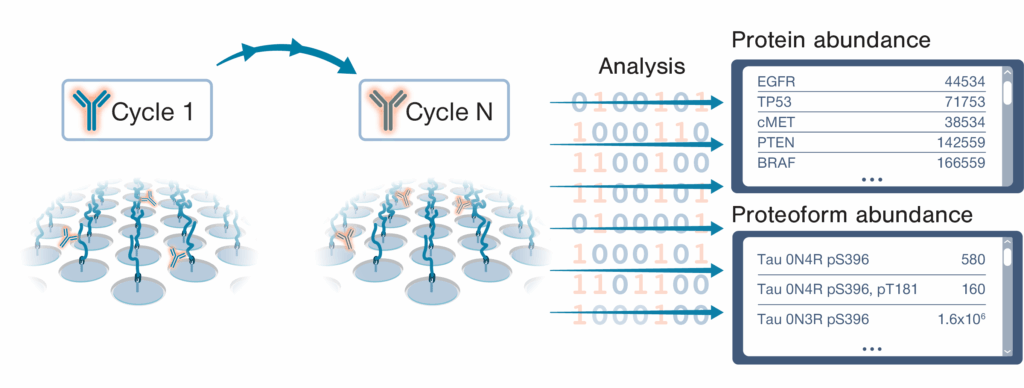 The NautilusTM Proteome Analysis Platform employs a method called “Iterative Mapping” to measure proteins in broadscale proteomic analyses and proteoforms in targeted proteoform analyses. In Iterative Mapping, millions to billions of intact, denatured protein molecules are bound to nano-fabricated flow cells at distinct coordinates. Then, the proteins are repeatedly interrogated with fluorescently labeled probes designed to bind either short amino acid sequences (~3 amino acids) in broadscale proteomic analysis or proteoform features such as post translational modifications and isoform-specific sequences in targeted proteoform analysis. These probes are iteratively introduced to the flow cells (one probe per cycle). Machine learning-powered algorithms use observed binding patterns to identify each protein or proteoform at the single-molecule level, and identifications are summed to measure abundance.
Overall, these contrasting proteoform profiles indicate tau biology may be very different in these three separate cohorts. This differential tau biology may play a role in mechanisms underlying disease severity.
Table 1 – Attributes of cognitively normal, ADRD with cognitive impairment, and ADRD with cognitive impairment and the most severe pathology human brain samples analyzed in this work.
Figure 1 – Hierarchical clustering of patient samples by proteoform profiles differentiate clusters of samples from patients that are cognitively normal, patients with ADRD and cognitive impairment, and one patient with ADRD, cognitive impairment, and the most severe pathology. The heat map portrays the abundances of the proteoforms defined by the epitopes shaded in black below it. The heat map contains one proteoform per column and one sample per row with 3 replicates per sample. More orange is more abundant, more blue is less abundant.
Designing precision medicines based on proteoform profiles
Zooming in on the proteoforms with differential abundance between the ADRD samples with cognitive impairment and the one with cognitive impairment and the most severe pathology, a quadruply phosphorylated proteoform, 1N3R-pT181-pT217-pT231-pS396, stands out as having minimal abundance in other samples and high abundance in the cognitively impaired ADRD patient with the most severe pathology (Figure 2).
Figure 2 – The quadruply modified tau proteoform 1N3R-pT181-pT217-pT231-pS396 may be uniquely associated with ADRD with cognitive impairment and the most severe pathology.
This result is intriguing as it may indicate the quadruply phosphorylated tau proteoform is a driver or marker of severe disease. This finding must be confirmed in additional patient samples before it is studied in more detail. Nonetheless, it serves as a great example of the unique results that can be obtained with proteoform data. If the presence of this proteoform is confirmed in more severe ADRD cases, it may be fruitful to determine:
- Which kinases are responsible for its creation.
- The order and timing of the creation of proteoforms that precede this proteoform.
- How specific this proteoform is for severe ADRD.
Such efforts could form the basis of work that develops this proteoform as a drug target or biomarker. For instance, in drug targeting efforts, researchers might:
- Develop antibodies that clear this specific proteoform from the brain.
- Develop small molecules that inhibit kinases responsible for the creation of this proteoform.
Depending on this proteoform’s association with severe ADRD or disease progression more generally, measuring it as a biomarker may reveal:
- Patients who can participate in proteoform-targeting clinical trials.
- Patients who are likely to progress to severe disease.
- Patients who would benefit from aggressive treatment versus those who are unlikely to benefit and should therefore undergo palliative care.
All-in-all, deeply exploring the relationships between proteoforms and disease may drive new drug development efforts and provide physicians with the information necessary to effectively guide patient care.
Enabling a new era of research with Iterative Mapping of proteoforms
In this blog series, we’ve shown that Iterative Mapping:
- Is designed to reveal novel information about biology by accurately, sensitively, and reproducibly measuring proteoforms over a wide dynamic range.
- Generates unique insights into proteoform groups that are difficult or impossible to achieve with other technologies.
- Answers previously unanswered questions about proteoform biology.
- May give researchers unique insights into model systems, basic biology, and disease that can both accelerate research and open new avenues for drug development.
We hope you’ve enjoyed this series! For more detail:
MORE ARTICLES