Proteoforms are not random – evidence for order in the creation of proteoforms

Tyler Ford
July 17, 2025
There are many open questions about proteoforms. They are the functional variants of proteins found in biological systems. Yet until now, the tools available to identify and measure them have been limited. Thus, we have minimal understanding of the scope of proteoform complexity in any given biological system. In our preprint, we used Iterative Mapping to chart the complexity of the tau proteoform landscape by answering the following questions:
- How many phosphorylations are found on individual tau molecules?
Previous studies show that tau can be phosphorylated at many sites, but they rarely have the resolution to determine if individual tau molecules are phosphorylated at multiple sites simultaneously. Iterative Mapping can determine the number of phosphorylations per tau proteoform at the single-molecule level.

- What combinations of tau phosphorylation are found on tau molecules?
Since we don’t usually know if single tau proteoforms are modified in multiple ways, we also don’t know which phosphorylations co-occur. Dintinct combinations of phosphorylation may change tau structures, activities, and interaction partners in distinct ways. - What mixtures of tau proteoforms are present?
It’s likely that mixtures of proteoforms determine the functions of biological systems. Thus, it’s not enough to simply detect that a species of tau is present, we must quantify multiple tau species simultaneously to understand their relationship to function. - Is there timing and coordination underlying the creation of tau proteoforms?
It may be the case that tau simply needs to be heavily modified (e.g. hyperphosphorylated) to play a role in one biological process over another and that tau proteoforms with combinations of modifications arise randomly. If the specific combinations of sites do matter for a biological function, they should not arise randomly, and this may offer further opportunities for the creation of drugs that precisely limit or enhance the generation of specific combinations of modification.
In our recent bioRxiv preprint, we used Iterative Mapping to answer these questions and discuss the answers below. In the next post in this series, we’ll explore the important impact these answers may have on our understanding of biology, disease, and drug development.
For more detail now:
- Read our full pre-print.
- Explore the quantitative benefits of Iterative Mapping of proteoforms in our Tech Note.
- Read our App Note discussing tau proteoform analysis.
- Watch our on-demand webinar covering this data.
How many phosphorylations are found on individual tau molecules?
Short answer – It depends on the sample and system, but often multiple.
We used Iterative Mapping to identify the number of phosphorylations on individual tau molecules in the following biological models:
Cellular models:
-iNeurons
-MiBrains
-Organoids with various Alzheimer’s disease mutations
Animal models:
-Mouse brain extracts
-Human brain extracts
-Healthy, aged human brain extracts
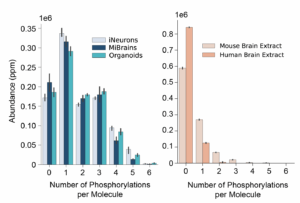
As you can see if Figure 1, the cellular models had a broad distribution of phosphorylations per molecule, and a sizable fraction of all samples had 5 or more phosphorylations.
Box 1 – A brief introduction to Iterative Mapping
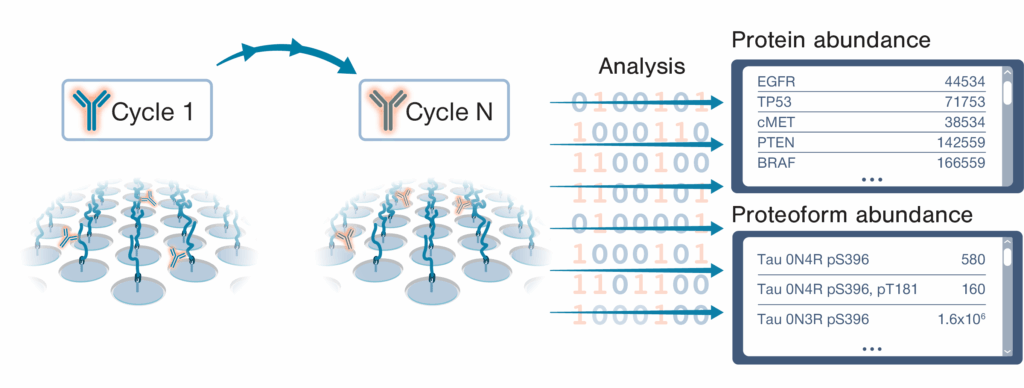 The NautilusTM Proteome Analysis Platform employs a method called “Iterative Mapping” to measure proteins in broadscale proteomic analyses and proteoforms in targeted proteoform analyses. In Iterative Mapping, millions to billions of intact, denatured protein molecules are bound to nano-fabricated flow cells at distinct coordinates. Then, the proteins are repeatedly interrogated with fluorescently labeled probes designed to bind either short amino acid sequences (~3 amino acids) in broadscale proteomic analysis or proteoform features such as post translational modifications and isoform-specific sequences in targeted proteoform analysis. These probes are iteratively introduced to the flow cells (one probe per cycle). Machine learning-powered algorithms use observed binding patterns to identify each protein or proteoform at the single-molecule level, and identifications are summed to measure abundance.
The animal models had fewer phosphorylations per molecule on average, but even here, some of the tau molecules measured had 2 or more phosphorylations. Overall, it is not uncommon to find single proteoforms with multiple modifications. These results indicate it is worthwhile to measure tau proteoforms as opposed to isolated modifications.
What combinations of phosphorylation are found on individual tau molecules?
There are many different combinations of modification found on the tau molecules quantified in our preprint. Using our 12 probes, we could theoretically measure 768 proteoforms composed of different tau isoforms with different patterns of modification. Interestingly however, only 130 of these potential proteoforms were detected. Thus, while there are certainly many tau proteoforms in these biological systems, they appear restricted in some way. This was a strong indication that the creation of tau proteoforms may not be random.
What mixtures of tau proteoforms are present?
As we briefly discussed in the previous post in this series, the model systems we studied had distinct proteoform profiles. That is, they had distinct mixtures of proteoforms and these mixtures changed over time (Figure 2). These distinct profiles are likely an indication of the differential biology contained in these different sample types. Taylor Bertucci Ph.D., Principal Investigator at the Neural Stem Cell Institute, is currently studying what biology some of these differential profiles encapsulate. Taylor describes some of her preliminary observations in our recent webinar.
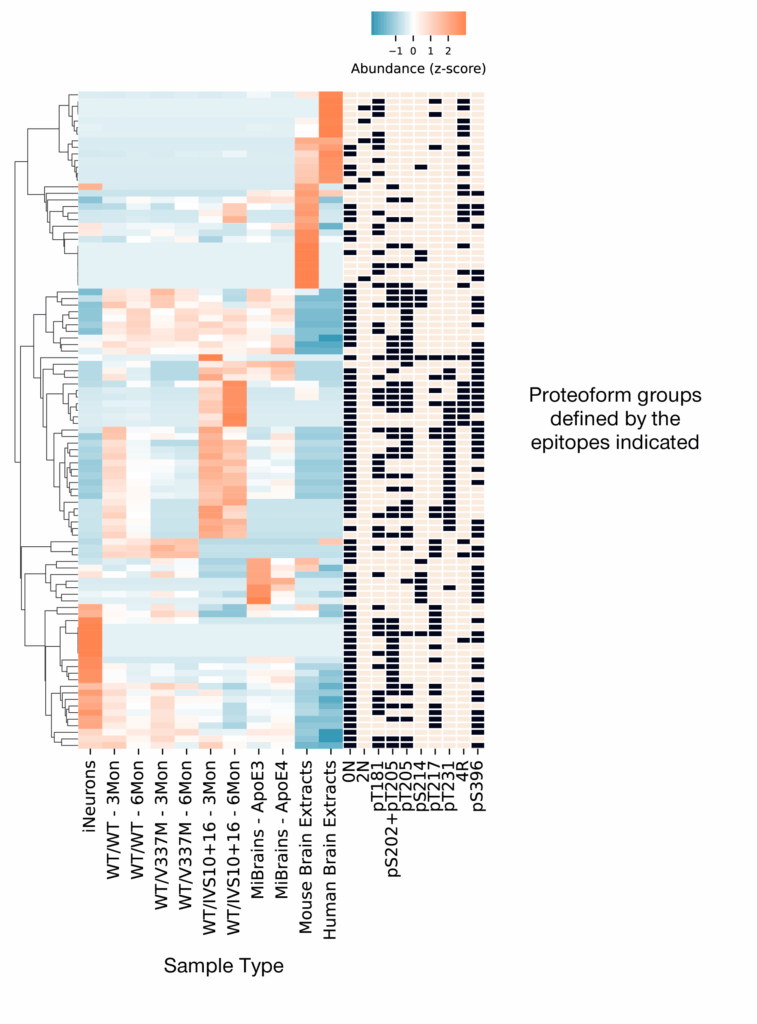
Figure 2 – Iterative Mapping reveals differential proteoform group profiles in different sample types. Each row contains a different proteoform group defined by the presence or absence of the epitopes indicated in the black and tan boxes. Each column in the blue/orange heatmap represents a different sample type as indicated by the labels below each column. In the heat map, orange indicates higher relative abundance while blue indicates lower relative abundance. Read our preprint for more information.
In addition to the model systems featured above, we used Iterative Mapping to quantify tau proteoforms in samples from patients with and without Alzheimer’s Disease and Related Dementias (ADRD). The profiles contrasted samples from people without ADRD, those with ADRD and cognitive decline, and one with ADRD, cognitive decline, and severe pathology. We dive into this data in further detail in the next post in this series, but you can explore it now in our App Note.
Is there timing and coordination underlying the creation of tau proteoforms?
The evidence in our preprint suggests the answer is yes, but this needs more investigation.
In our preprint, we observed that 4-month-old MiBrains contained different mixtures of tau isoforms than 2-month-old MiBrains (Figure 3) as was expected from previous work. This implies there are different proteoforms in the two sets of MiBrains and the 4-month-old MiBrain proteoforms arise after the 2-month-old MiBrain proteoforms. The precise proteoforms and order of their creation is not clear in this miBrain data, but we observed more highly resolved differences in the proteoform profiles of the 3 month and 6 month old organoids shown in Figure 2.
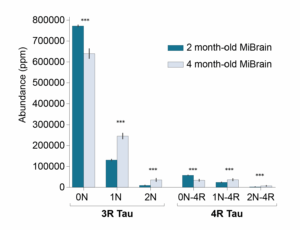
Figure 3 – Tau isoforms (and therefore proteoforms) measured in MiBrains change over time.
More insights into the order underlying the creation of tau proteoforms comes from our analysis of the co-occurrence of any given tau phosphorylation with other phosphorylations. We observed that some phosphorylations co-occur more often than others (Figure 4) suggesting these modifications may influence one another.
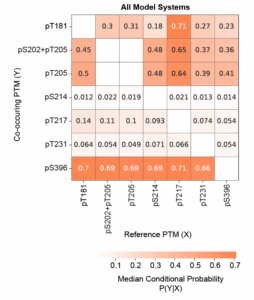
Figure 4 – Some tau phosphorylations increase the probability of others. Probability of observing the co-occurring tau PTM shown on the Y-axis given the reference PTM on the x-axis. Increased probability of one PTM given another suggests that the PTMs influence one another and that coordinated modification pathways exist.
Analysis of the multiply modified proteoforms observed further suggests that the specific combinations of modifications found on tau proteoforms are not random. The evidence for this comes first from the fact that observed proteoforms are sometimes present at abundances higher and lower than would be expected by chance (Figure 5). Furthermore, as we’ll discuss in the next blog post in this series, the proteome profiles of samples from patients without ADRD, patients with ADRD and cognitive decline, and one with ADRD, cognitive decline, and severe pathology all differ substantially. Thus, not only are these multiply modified proteoforms not random, but they also appear to associate with specific phenotypes.
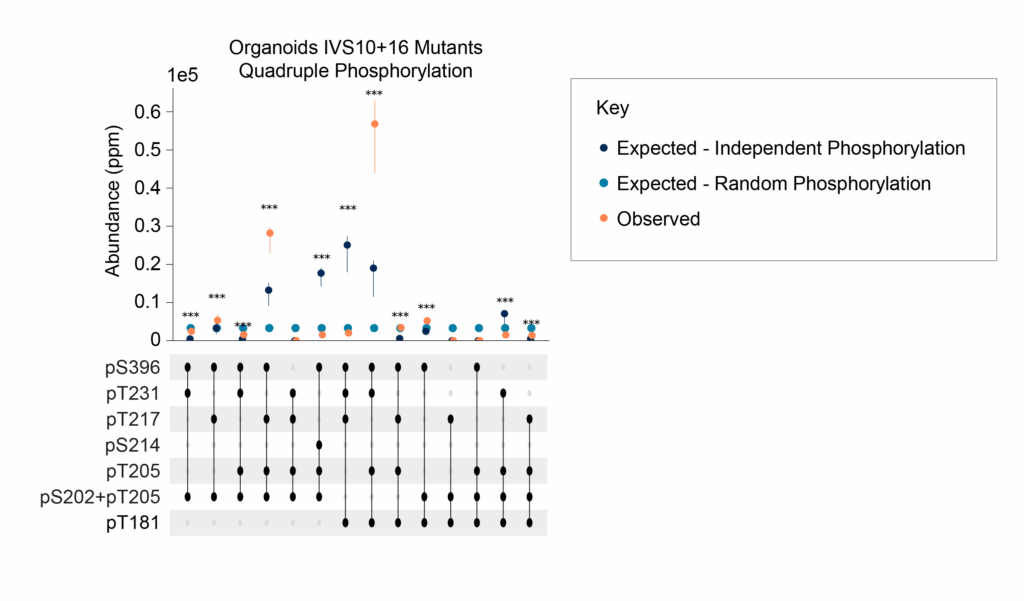
Figure 5 – Evidence for the non-random generation of multiply modified proteoforms. The abundance of quadruply modified proteoforms observed (orange) is sometimes higher or lower than would be expected by random chance (light blue dots) or by random chance constrained by the observed abundance of the modifications (navy blue dots).
Specific proteoforms may play unique roles in biology and disease
Our data indicates that tau proteoforms often come with multiple modifications, that a subset of possible proteoforms are detected, that different sample types have different proteoform profiles, and that there may be order underlying the creation of multiply-modified proteoforms. As you’ll learn in greater detail in our next blog post, proteoforms may play distinct and important roles in healthy biology and disease.
Overall, this data indicates that researchers can learn much more about biology if they examine their samples at the proteoform-level using a single-molecule method like Iterative Mapping. As we’ll discuss in the next post, doing so may reveal new ways to target proteoforms to prevent, treat, or even cure disease.
Don’t want to wait for the next post in this series? Read our full pre-print, our Tech Note, our App Note, or watch our webinar covering this data now.
MORE ARTICLES