
Iterative Mapping provides in-depth views of proteoform groups

Tyler Ford
July 10, 2025
As the functional variants of proteins, proteoforms drive the molecular mechanisms underlying biology. Yet, most technologies that measure proteins at scale either average signals coming from diverse mixtures of proteoforms (think the bands on western blots and 2D gels) or enzymatically digest proteins before analysis (think bottom-up mass spectrometry), and scientists rarely have the ability to identify and quantify the combinations of alternative splicing, post translational modifications, and other alterations that define proteoforms.
We recently published a preprint introducing Iterative Mapping as a novel, single-molecule method to measure proteoforms in a scalable, adaptable manner. In the preprint, tau proteoform measurements are exemplars for the power of proteoform-aware analysis. For more on the method and why tau proteoforms make such powerful exemplars, see the previous blog post in this series. For now, it suffices to say that knowledge of tau proteoforms may drive the development of new therapeutics and biomarkers for many neurodegenerative diseases.
In this blog post, we share how Iterative Mapping of proteoforms enables researchers to achieve proteoform group resolution in a way that is readily scalable and adaptable with additional probes. This level of proteoform resolution provides researchers with unique views of the proteome and actionable information about biology that cannot be obtained with most other technologies. We’ll walk through a theoretical example demonstrating how our technology is different and then provide a sneak peek at data demonstrating the power of our method before diving into additional data in the next two posts in this series.
For additional technical information now:
- Read our preprint covering Iterative Mapping of proteoforms
- View our webinar to explore some of the preprint data with Parag Mallick of Nautilus and Taylor Bertucci of the Neural Stem Cell Institute
- Explore the quantitative benefits of Iterative Mapping of proteoforms in our Tech Note
Read all posts in this series covering:
- Metrics demonstrating the benefits of Iterative Mapping on the Nautilus Proteome Analysis Platform (Post 1).
- The new kinds of analysis Iterative Mapping of proteoforms enables (This post).
- How Iterative Mapping answers key questions about tau proteoform biology (Post 3).
- How our preliminary tau proteoform data demonstrates the potential impact of proteoform-level analysis on the development of next-generation therapeutics and biomarkers for not just ADRD, but all diseases (Post 4).
Proteoform families, groups, and distinct proteoforms
It’s useful to think about “proteoform analysis” at three levels (Figure 1). You can analyze proteoforms in terms of:
- Proteoform families – A proteoform family consists of all the unique protein variants derived from a single gene. Some technologies, like top-down mass spectrometry, can give you a rough idea of the size of a proteoform family without necessarily characterizing the members of that family in depth.
- Proteoform groups – Proteoform groups are subsets of proteoform families containing shared sets of observed alterations. Studies that analyze proteoform groups may not reveal the exact modification state of every amino acid in a protein molecule but will reveal a subset of them. For example, two separate tau proteoform groups may be:
- All tau molecules phosphorylated at T231 and T181 but not S396 or T217
- All tau molecules phosphorylated at S396 and T217 but not T231 or T181
Box 1 – A brief introduction to Iterative Mapping
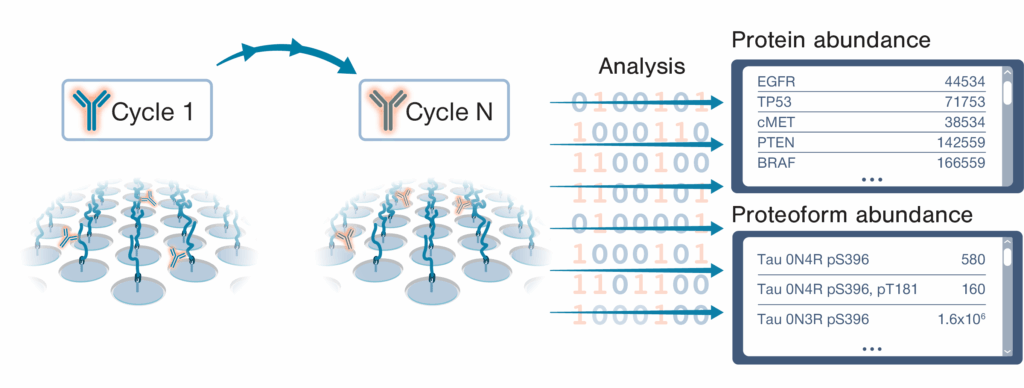 The NautilusTM Proteome Analysis Platform employs a method called “Iterative Mapping” to measure proteins in broadscale proteomic analyses and proteoforms in targeted proteoform analyses. In Iterative Mapping, millions to billions of intact, denatured protein molecules are bound to nano-fabricated flow cells at distinct coordinates. Then, the proteins are repeatedly interrogated with fluorescently labeled probes designed to bind either short amino acid sequences (~3 amino acids) in broadscale proteomic analysis or proteoform features such as post translational modifications and isoform-specific sequences in targeted proteoform analysis. These probes are iteratively introduced to the flow cells (one probe per cycle). Machine learning-powered algorithms use observed binding patterns to identify each protein or proteoform at the single-molecule level, and identifications are summed to measure abundance.
Critically, the members of these two proteoform groups may have other modifications, but they are defined by the subsets that a given a technology can see. Iterative Mapping of proteoforms technically quantifies proteoform groups. These groups can be made narrower as additional probes are used to refine the proteoforms identified. Few methods other than Iterative Mapping and top-down mass spectrometry can measure proteoform groups.
- Distinct proteoforms – These are fully defined protein molecules wherein the modification state of every amino acid is known. No technology can fully define every protein molecule in a sample today. Top-down mass spectrometry can theoretically fully define proteoforms but often cannot distinguish proteoforms with similar masses. It is also impractical to use top-down mass spectrometry at scale.
Iterative Mapping of proteoforms enables researchers to achieve proteoform group resolution in a way that is readily scalable and adaptable with additional probes. This level of proteoform resolution provides researchers with unique views of the proteome and actionable information about biology that cannot be obtained with most other technologies. It is likely that distinct proteoforms do not need to be resolved for an actionable understanding of a biological process. Nonetheless, one of the key benefits of Iterative Mapping is that, by increasing the number of probes used to analyze a given proteoform family, it can resolve more and more refined proteoform groups as needed. Theoretically, it could even resolve distinct proteoforms if enough probes were available, but this will not usually be practical or necessary.
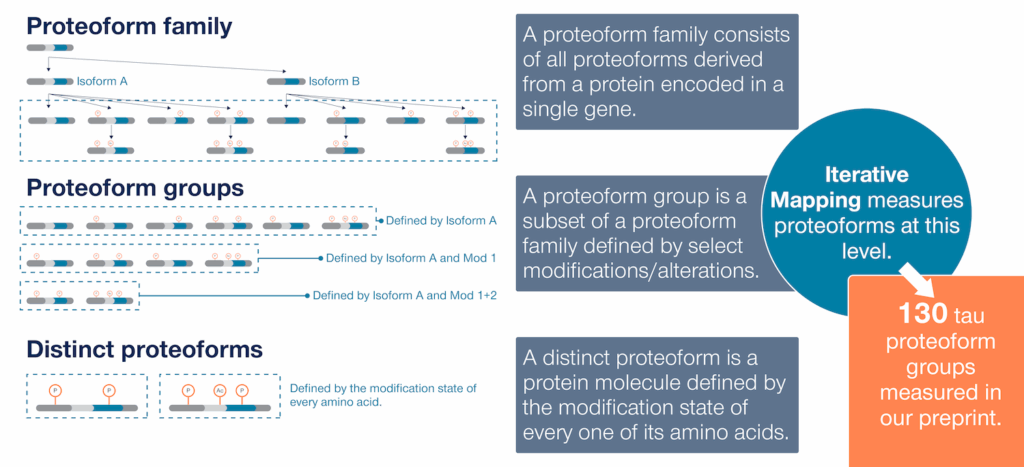
Figure 1 – Proteoform families, proteoform groups, and distinct proteoforms
Proteoform-group resolution reveals molecular differences that are invisible at the protein or PTM level
For a theoretical example of why it’s important to measure proteoform groups, consider the protein mixtures represented in Figure 2. Mixture A is from a cognitively normal individual, while Mixture B is from an individual in cognitive decline. These two groups are clearly different at the molecular level, but these differences cannot be discerned without proteoform group resolution. For instance, if you analyzed these samples looking at total protein levels, they would be the same across both samples.
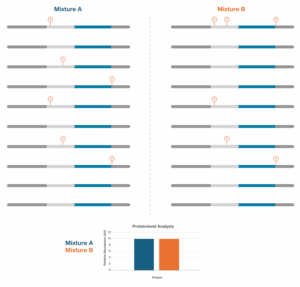
Figure 2 – Analyzing mixtures A and B by measuring protein abundances doesn’t reveal any differences between the mixtures.
If you look with a little more resolution at the PTMs present using a technology like bottom-up mass spectrometry, you still may not see any differences (Figure 3). This is because bottom-up mass spectrometry breaks proteins into peptides. The peptides can be quantified but cannot be put into proteoform groups defined by anything other than the single PTMs found on each peptide.
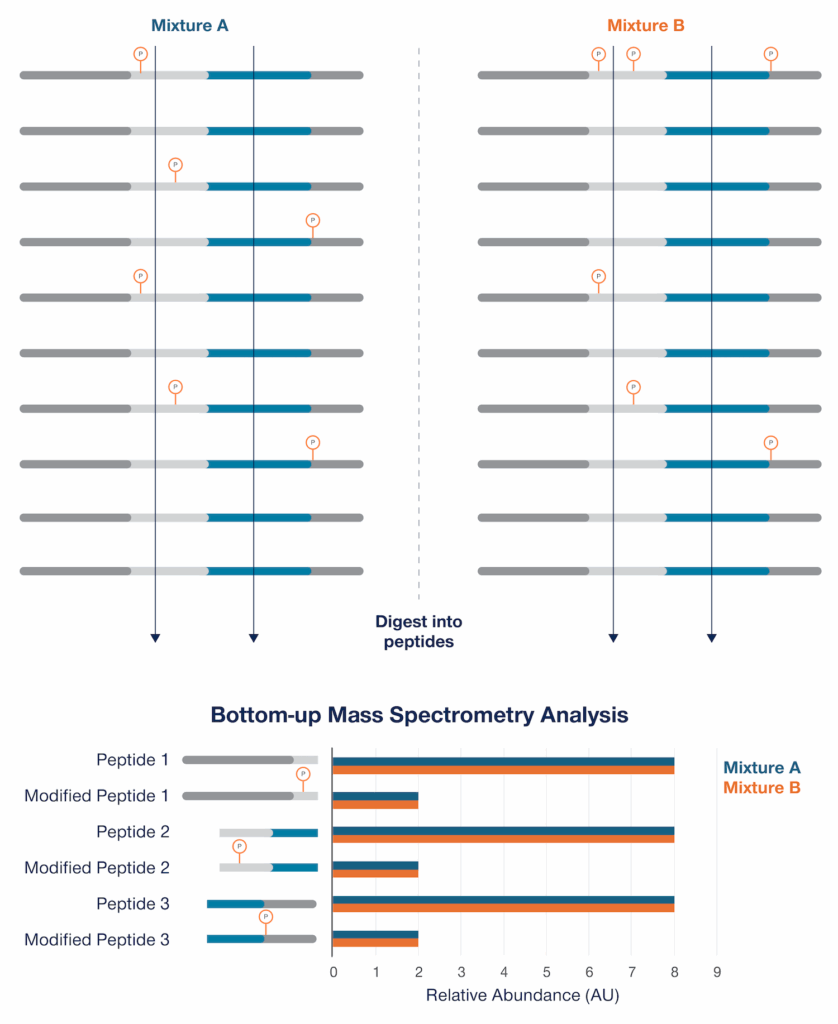
Figure 3 – Peptide/PTM analysis by bottom-up mass spectrometry doesn’t reveal any differences between the two mixtures because the peptides and PTMs cannot be attributed to proteoform groups defined by anything but the modifications found on the individual peptides. In this example, the peptides generated from the proteins in the mixtures are demarcated by the vertical lines pointing to the chart at the bottom of the figure. These lines represent enzymatic digestion sites.
By contrast, using Iterative Mapping, even if we don’t probe every possible modification, we can still observe differences in proteoform groups defined by the patterns of probed PTMs found on the intact protein molecules (Figure 4). These proteoform groups are defined by the presence and absence of the PTMs probed. The differences between these groups may underlie cognitive decline but would be missed with other technologies.
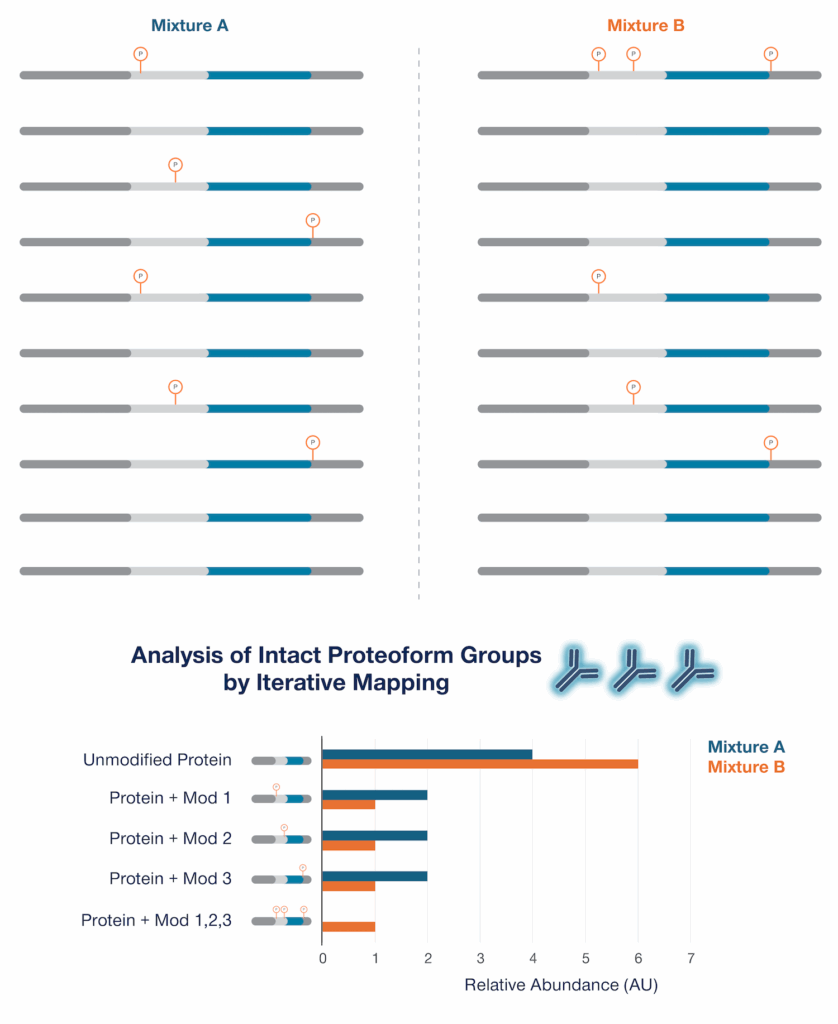
Figure 4 – Proteoform group analysis by Iterative Mapping reveals differences between Mixture A and Mixture B. In this scenario, Iterative Mapping would probe for the 3 phosphorylations indicated using three detection probes (represented by the antibodies in the figure) and the presence and absence of these specific phosphorylations can be used to define proteoform groups (Defined proteoform groups are depicted graphically on the Y axis of the chart. Here “Protein + Mod X” also indicates a lack of the other modifications probed. Combinations of modification other than those shown are possible but are not detected). More probes would be needed to further divide these 5 proteoforms groups into more specific groups, but this level of analysis may be sufficient to reveal many of the molecular differences underlying these mixtures.
Iterative Mapping reveals proteoform group differences in model systems
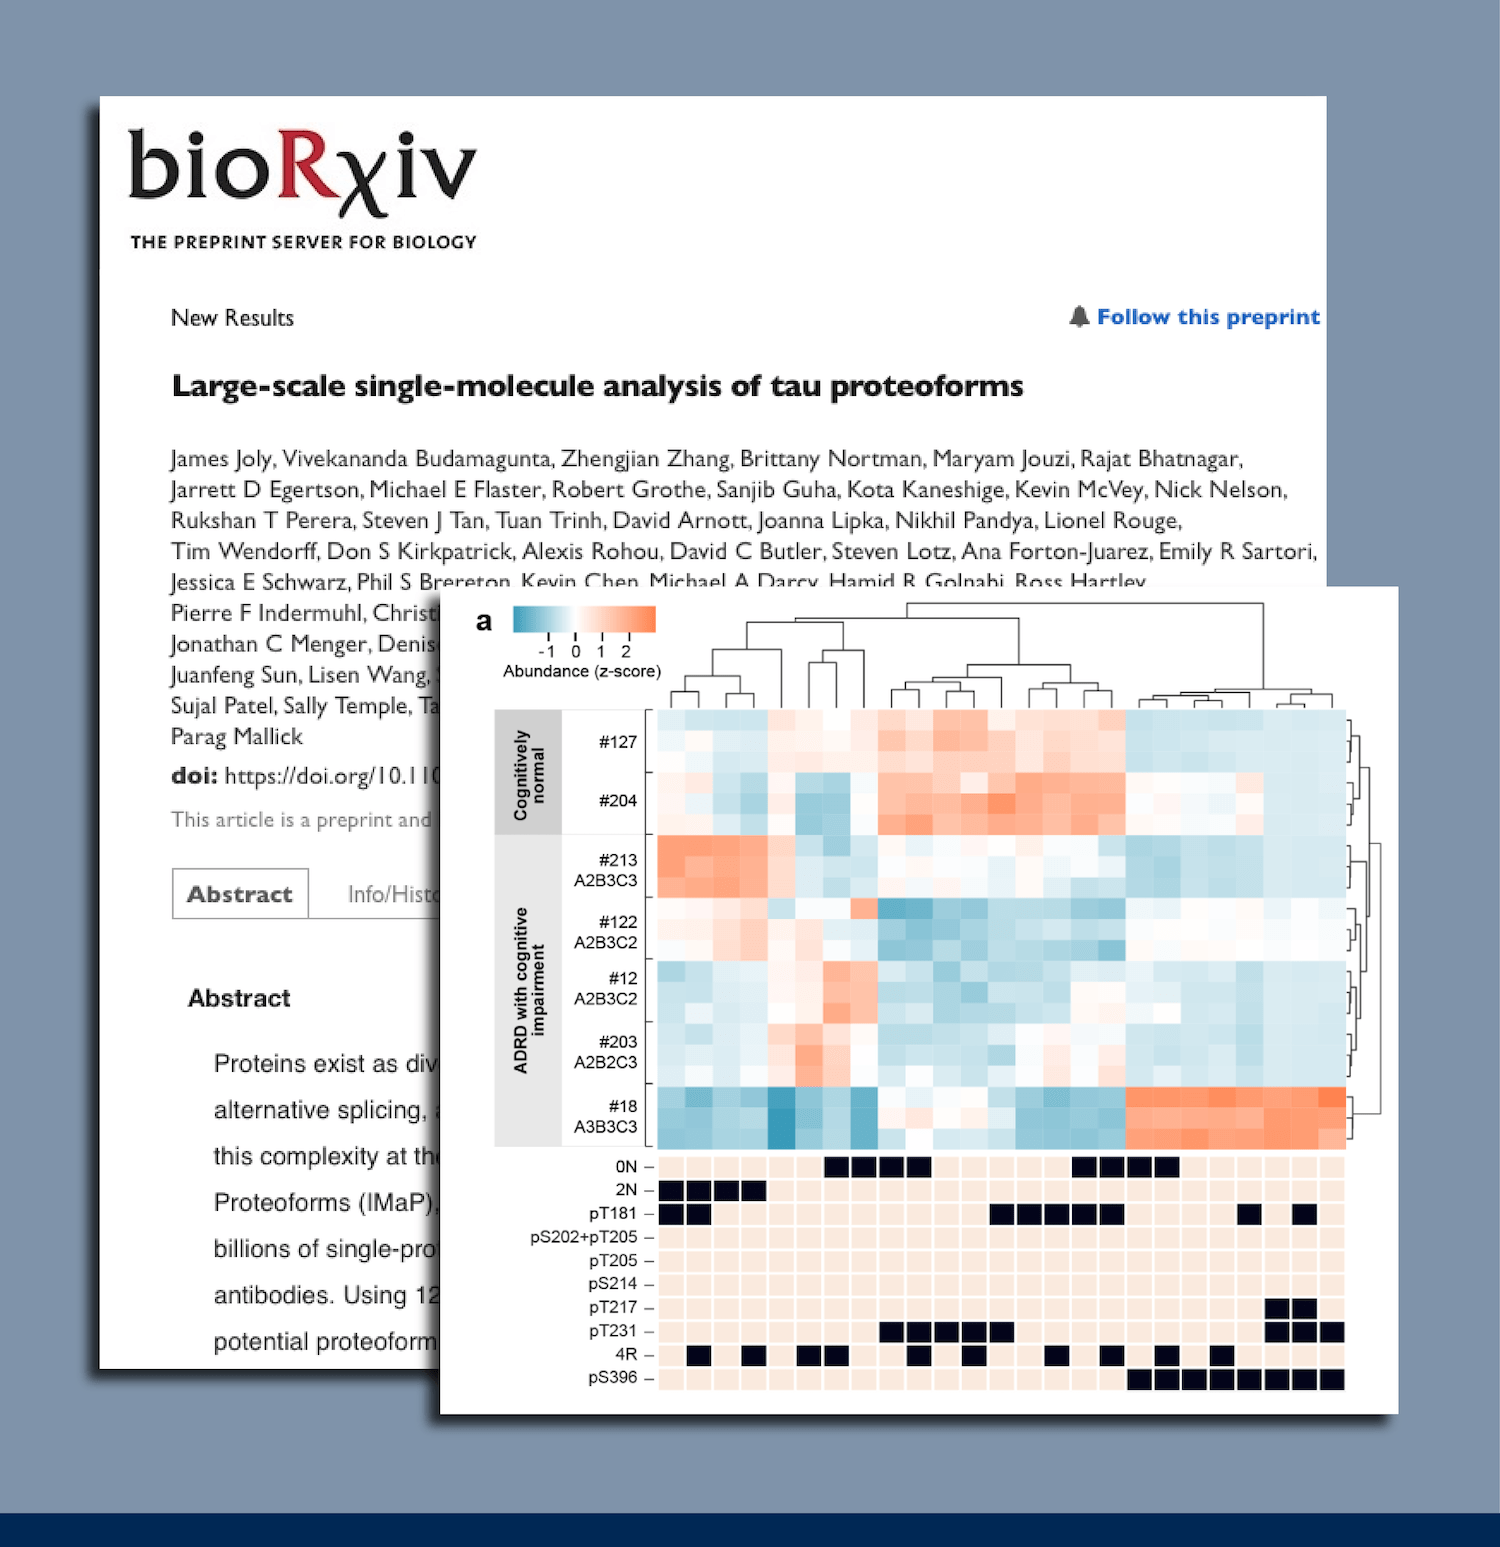
As a preview of the kind of data generated by Iterative Mapping of proteoforms, we share proteoform group profiles of various sample types and model systems examined in our preprint (Figure 5). We dive deeper into the nuances of this kind of data in our next two blog posts. For now, it is hopefully clear that different sample types contain different mixtures of proteoform groups. This may be an indication of the differential biology captured in each sample type.
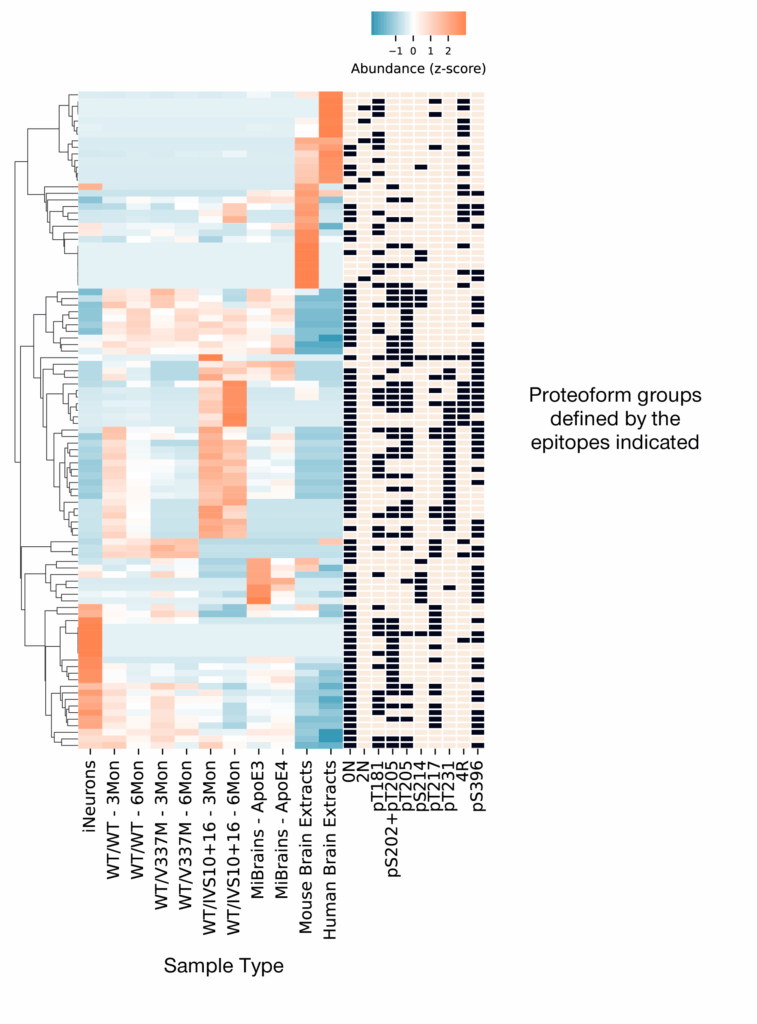
Figure 5 – Iterative Mapping reveals differential proteoform group profiles in different sample types. Each row contains a different proteoform group defined by the presence and absence of the epitopes indicated in the black and tan boxes. The columns in the blue/orange heatmap contain different sample types as indicated by the labels below each column. In the heat map, orange indicates higher relative abundance while blue indicates lower relative abundance. Read our preprint for more information.
We look forward to exploring proteoform-group data generated by Iterative Mapping of proteoforms in the next posts in the series. If you’d like more information now:
MORE ARTICLES