
Proteoforms, metastasis, and cancer therapy responses – Applications of proteomics in cancer

Tyler Ford
June 5, 2025
Aberrant signaling often drives cancer cell growth. Indeed, some of the most effective cancer drugs inhibit the activities of key signaling proteins – these include kinase inhibitors like imatinib, receptor blocking antibodies like herceptin, and immune checkpoint inhibitors like anti-PD-1 antibodies. Often, the proteins targeted by these drugs are known to be mutated in cancer cells, are key members of pathways with mutated components, or are known to be important to the body’s response to cancer.
Yet, while we know abnormal signaling can be a cause and point of attack in cancer, we do not know the extent to which cancer mutations change the functional proteoforms in their associated signaling pathways. Furthermore, we don’t know if certain proteoform profiles in individual signaling pathways make those pathways more or less amenable to modulation with therapeutics. Researchers know that particular kinds of post translational modification (PTM) or modifications to particular residues can increase or decrease in cancer cells, but they rarely know how the combinations of modifications found on proteoforms change in cancer cells.
It is critical to understand what proteoforms can be found in cancer cells because signaling outcomes are not dictated by the presence or absence of single modifications on signaling proteins. It is the mixtures of proteoforms in cells that dictate outcomes. For instance, a protein that is singly phosphorylated may itself phosphorylate one set of proteins, but if it is doubly phosphorylated it may scaffold and phosphorylate a different set of proteins. Then if it is doubly phosphorylated and ubiquitinated, it may be rapidly degraded (see a similar, real-world example in EGFR signaling). Measuring one of these modifications will not only leave you with limited understanding but may also be misleading.
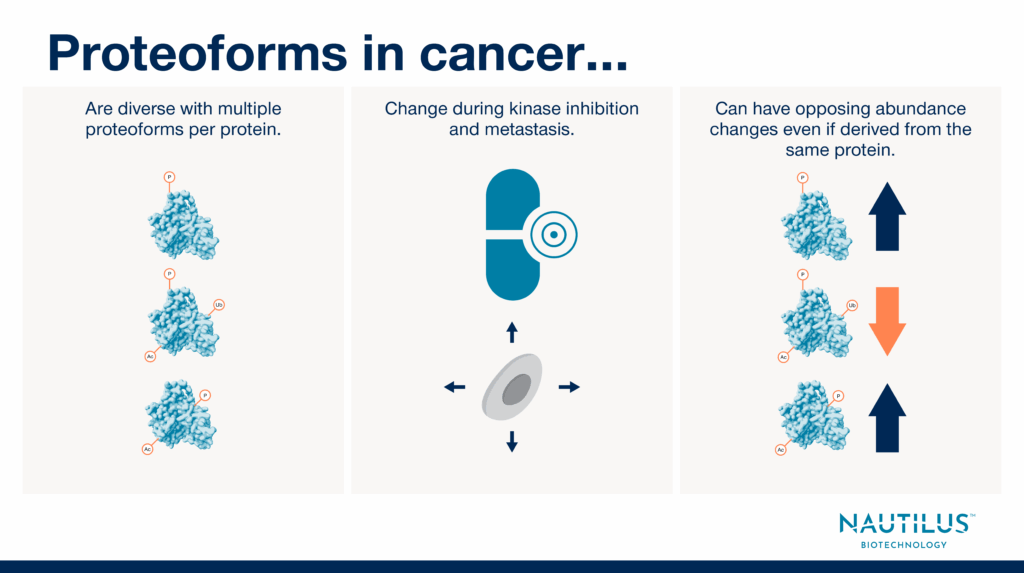
Nonetheless, researchers are only just beginning to appreciate the critical importance of proteoforms. In cancer research, one of the first steps toward learning more about the impact of proteoforms on disease progression and treatment is to determine the extent to which proteoforms change in cancer cells. Below, we highlight three papers leveraging proteomics to show proteoforms:
- Are diverse in cancer cells.
- Change during kinase inhibition and metastasis.
- Can have opposing abundance changes even when derived from the same protein.
Deeply exploring similar findings in future work may reveal the unique ways cancer cells grow and respond to treatment. Such experiments could become the raw materials needed for new biomarkers and targeted therapies that precisely alter biology in cancer cells and not healthy ones.
Proteoform diversity in HeLa cells treated with a broad-spectrum kinase inhibitor
Chowdhury et al., 2024 from the Wu Lab at the University of Alabama used top-down proteomics to measure proteoform changes in HeLa cells treated with a broad-spectrum kinase inhibitor called staurosporine. While their specific results are not necessarily directly applicable to the clinic given the broad activity of staurosporine and the lab-adapted nature of HeLa cells, they do demonstrate the critical importance of proteoform measurements by showing:
- Most of the 215 proteins identified had 2 or more proteoforms – This shows it’s common for a single protein to come in multiple varieties.
- Distinct proteoforms derived from the same protein can change abundance in opposite directions – This means measuring “protein” as opposed to proteoform abundance may mask heterogenous changes in protein variants with different functions.
- Even under kinase inhibition, some phosphorylated proteoforms had increased abundance – Impacts on proteoforms are not always direct or obvious. While one might expect kinase inhibition to decrease phosphorylation, network effects and indirect impacts may cause the opposite outcomes. As always, biology is complicated.
Taken as a whole, these results provide evidence that things happening at the proteoform level are obscured if you only look at changes in protein levels or modification abundance.
In addition, these results highlight some of the limitations of top-down proteomics. These researchers measured 1,187 proteoforms coming from 215 proteins. There are likely many more proteins and proteoforms. There were also numerous instances wherein these researchers could not identify individual modifications or modification sites with high confidence. For example, there were unidentified modifications to proteoforms of the JUPI1 protein, and they could not localize phosphorylations on the 4EBP1 protein. Next generation proteomics platforms like the NautilusTM Proteome Analysis Platform may enable researchers to measure more proteoforms and achieve higher proteoform resolution.
Proteoform responses to treatment with the Ibrutinib kinase inhibitor
Leo et al., 2025 identified proteoforms using thermal proteome profiling and functional proteoform group detection. In this technique, putative proteoforms are defined by groups of peptides with similar thermal profiles:
- To get the thermal profiles, samples are separated and heated to specific temperatures. At each temperature, some fraction of each proteoform will denature depending on its structure and thermal stability. Denatured proteoforms form insoluble aggregates that are removed from the samples. Soluble proteoforms are then treated with proteases for bottom-up mass spectrometry. The abundances of peptides derived from individual genes are plotted against temperature. These are “thermal profiles”.
- Groups of peptides from the same gene with similar thermal profiles are considered “functional proteoform groups.” Often, distinct proteoforms derived from the same protein can be identified in this way and they may behave differently under different conditions. For example, drug treatment may cause changes to one proteoform’s thermal profile but not another. This may indicate that the drug interacts with the proteoform with the altered profile.
- While this technique identifies putative proteoforms, it cannot, on its own, identify what isoforms and post translational modifications give rise to these proteoforms.
In this work Leo et al., 2024 specifically investigated how various proteoforms respond to treatment with a kinase inhibitor called ibrutinib. Ibrutinib blocks the activity of the Bruton tyrosine kinase (BTK) and is used to treat chronic lymphocytic leukemia. The researchers assessed whether detected proteoforms’ thermal profiles changed with Ibrutinib treatment. Those that did change likely interacted with ibrutinib either directly or indirectly.
Leo et al., 2024 discovered that some proteoforms derived from single proteins interact with ibrutinib while others do not. Furthermore, they showed that protein-level data can make it appear that a protein does not interact with ibrutinib, when in fact, some of its proteoforms do. They later used click chemistry and pull-down experiments to verify some of the direct interactions with ibrutinib. This work thus provides critical evidence that protein-level drug interaction information obscures activity at the functional proteoform level.
Finally, these researchers used clinical samples to assess whether cells that were either sensitive or resistant to ibrutinib treatment had different proteoform profiles. They discovered that there were indeed differences and some of these involved proteoforms of earlier identified ibrutinib binders. Similar efforts could identify proteoforms or proteoform profiles indicative of responsiveness that could guide future treatments.
Importantly, while the functional proteoform technique used by Leo et al., 2024 provided great insights into the differential interactions between ibrutinib and select proteoforms derived from single proteins, it does not define these proteoforms. That is, it is not necessarily clear what modifications or spliceoforms give rise to the functional proteoform groups identified. As a result, further work is required to link the differential impacts observed to the molecular nature of these proteoforms and the processes that give rise to them.
Proteoform differences between metastatic and non-metastatic colorectal cancer cell lines
McCool et al., 2022 tested a variety of top-down proteomics methods leveraging capillary zone electrophoresis (CZE) followed by tandem mass spectrometry (MS/MS) to identify proteoforms in two colorectal cancer cell lines:
- SW480 – A non-metastatic colorectal cancer cell line
- SW620 – A metastatic colorectal cancer cell line
Summing across their various methods, McCool et al., 2022 identified over 23,000 proteoforms from over 2,300 proteins. Their most effective method combined CZE with size exclusion chromatography (SEC) to identify ~6,000 proteoforms in each cell line.
The authors went on to show that:
- Different proteoforms were identified in each cell line with only 40-50% of identified proteoforms overlapping between each cell line – This was particularly true in pathways such as WNT/Beta-catenin, mTOR, ERK/MAPK, and PI3K/AKT where there was <39% overlap between the two cell lines for each pathway.
- A variety of proteins gave rise to multiple proteoforms and individual proteoforms sometimes had a combination of modifications. Occasionally proteoforms derived from the same protein had opposing changes in abundance between non-metastatic and metastatic cells – For instance, one phosphorylated form of death-associated protein 1 (DAP) had higher expression in non-metastatic cells while another had higher expression in metastatic cells.
- Across both cell lines, there were 111 proteoforms with single amino acid variants and only 22 of these were found in both cell lines – They integrated transcriptomic data into their protein database to identify the proteoforms with single amino acid variants.
Considering the proteoforms changes observed, McCool et al., 2022 suggested a variety of biological pathways might be differentially affected in these cells, and some of these pathways, such as WNT/Beta-catenin, mTOR, and ERK/MAPK, may be involved in metastasis. These authors did not investigate the mechanisms by which these pathways might be affected, but studies like this one show there may be vast differences in proteoforms between cells with important functional differences. Importantly, some of the differences observed here may arise from simple missed detections – while there was more overlap in proteoforms detected within each cell line than between the two cell lines, the within cell-line overlap was still only 67%. Further advances in our ability to measure proteoforms will hopefully help us understand what these differences mean and how they can be rapidly measured and altered for future cancer biomarkers and treatments.
A strong role for proteoforms in cancer
Taken together, the above studies strongly suggest that proteoforms change across cancer development and treatment. Much more work must be done to identify how proteoforms alter biology, but the clear differences observed indicate we can learn much from such studies. Next-generation proteomics platforms like the NautilusTM Proteome Analysis Platform are designed to enable researchers to conduct in-depth studies of proteoforms, associate them with biological functions, and power the next generation of biomarker discovery and therapeutic development. We hope proteoform-aware technologies like these will lead to the next wave of targeted treatments for cancer and save many lives.
MORE ARTICLES